Claim 1
Brighten Academy students consistently outperform district and state averages, as well as national norms, in reading and math achievement.
Exceeding the State and the County
|
As a public charter school, our contract with the Douglas County School System and the Georgia Department of Education requires that we outperform either district OR state averages. This is in alignment with our EL Performance Benchmarks. We are very proud that we have not only been able to consistently outperform BOTH the district and the state, but also national norms as well, in both reading and math.
|

|
In the graphs below, the blue sections of the bars show the percentage of Brighten Academy students who earn a proficient score, or Level III score, on the Georgia Milestones Assessment; the red portion of each bar denotes the percent of Brighten Academy students who earned a distinguished score, or Level IV.
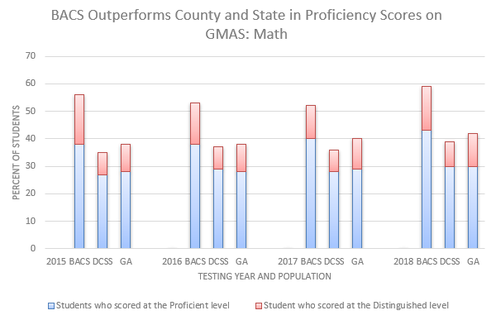
Examination of testing data leads us to reference Core Practice 33, which guided us in evidence-based strategic improvement. The slight decline in math performance spurred a discourse towards Workshop 2.0, a highly-recommended curriculum resource in EL Education, in which our teachers pushed themselves through gaps in their own mathematical understanding. Students grapple with complex problems, discuss strategies, and critique each other's thinking to deepen conceptual understanding that builds to strong mathematical fluency. As the 2018 data comes in, we are excited to see achievement gains at Brighten Academy!
|
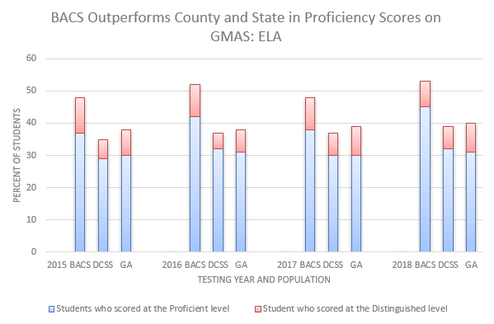
Observe in the ELA graph for the year 2016, the percentage of Brighten Academy students that scored proficient exceeded the combined percentages of district or state performance up through the distinguished level. Through a focus in reading instruction over the previous two years, students can independently grapple with complex informational and literary texts. They make sense of content by reading, thinking, talking, and writing about compelling topics. The 2018 data shows continued high performance levels from our students!
|
Our school is able to achieve these remarkable results because we closely monitor the performance of all of our subgroups. The Credential Data Sheet shows that we outperform the state and county average within each subgroup. Our subgroups include Economically Disadvantaged (FRL) and students with disabilities. We also disaggregate our data by race. By closely monitoring the achievement and growth of all our students, we have been able to consistently meet our Performance Benchmark targets. EL's Dimensions of Student Achievement guides our annual work plan and improvement initiatives.
Measuring Student Growth in Relation to School Growth
As a public charter school, Brighten has historically struggled with adequate funding. This lack of funding translated to an undersized, temporary building that did not meet the needs of the students. In order to optimize the funding formula in GA, we needed to double the size of the school. We strategically planned to increase each grade level from 2 homerooms to 4 homerooms over the course of six years. Over the course of two years, we added nearly 100 students to our school, and we are proud to report that anchoring evidence-based conversations with stakeholders, tied to the Core Practices, resulted in not only high achievement, but also high growth as shown in the sample data below.
|
|
|
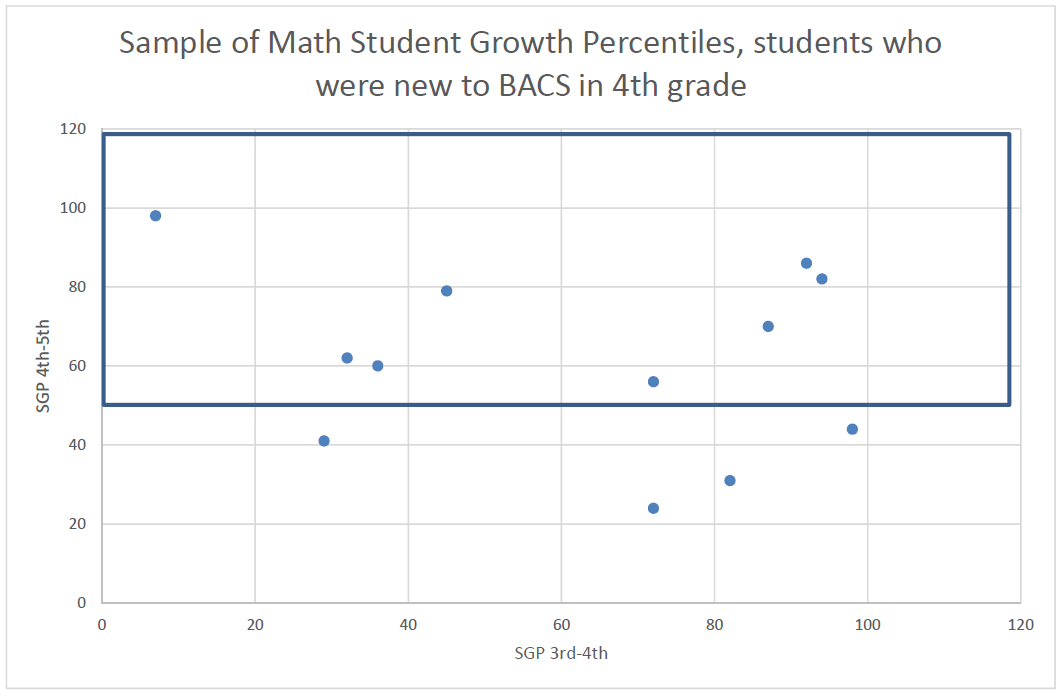
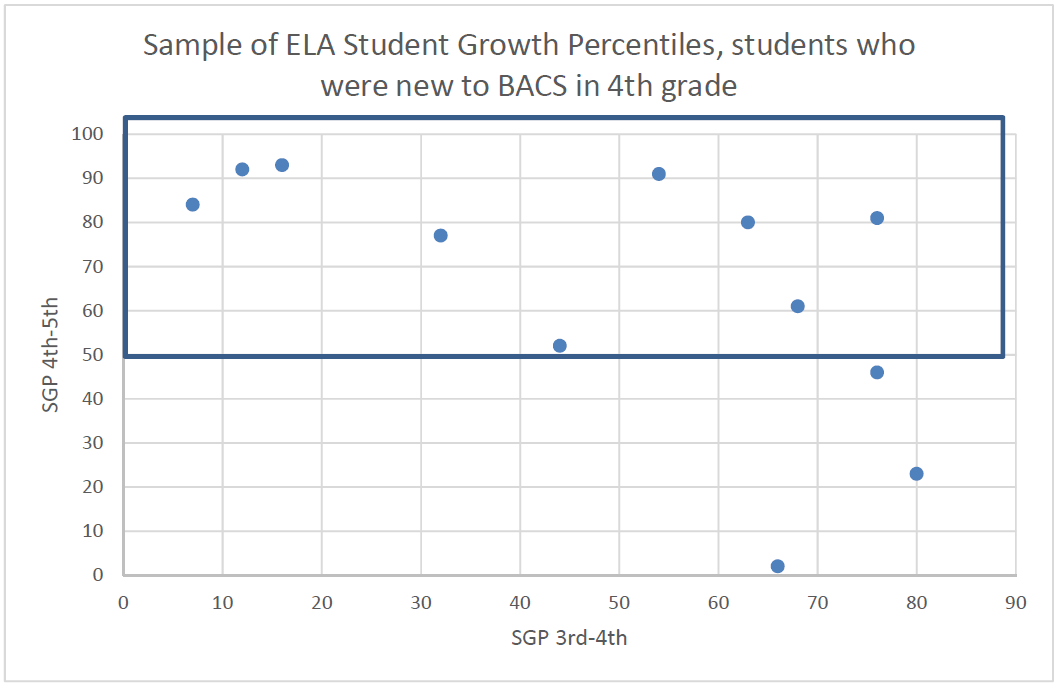
In this sample of students from the 2015 enrollment growth, the student data points within the box had an SGP (Student Growth Percentile) greater than 50% expected growth, having attended Brighten for the full year prior to testing. SGP data from 5th to 6th grade for this sample group will not be available until late 2018.
|
In their first year with Brighten Academy, 58% of the sample group demonstrated above-average growth from 3rd grade to 4th grade. By their second year with Brighten Academy, 75% of students in the sample demonstrated above-average growth in reading, with 67% of the sample showing growth in both reading and math.
|
As the school grew, we added and acclimated new staff to the EL vision of student achievement and the Core Practices. We realize that this is a growth process, normally lasting 2-3 years. As the staff and students grow with us, we are confident that our high levels of achievement will continue and be evident across district, state, and national comparisons.
Comparing Nationally
As Brighten adopted EL practices, we recognized the need to better monitor student achievement in a way that we could look at growth over time and contextualize our students' progress with the nation. True to our mission, we wanted to make sure that "every student, every year" showed measurable growth. The State's assessment was (and continues to be) in flux, so we researched a reliable tool to use over time. The Measuring Academic Progress (MAP) Assessment developed by the Northwest Evaluation Association was the perfect alignment for our needs.
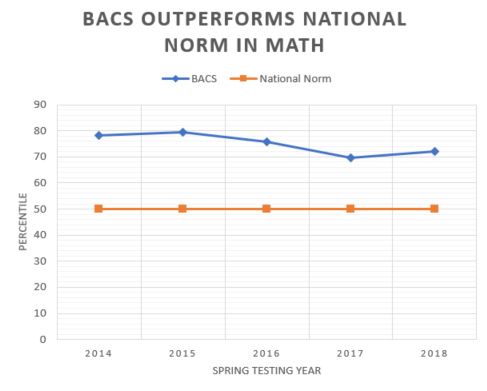
Through an analysis of our spring MAP data, Brighten Academy outperforms the 50th national percentile (orange line), at an average of 75% in Math. Spring 2018 data showed a small growth, across a school average, attributable to our focus on mathematical problem solving over the last 18 months.
|
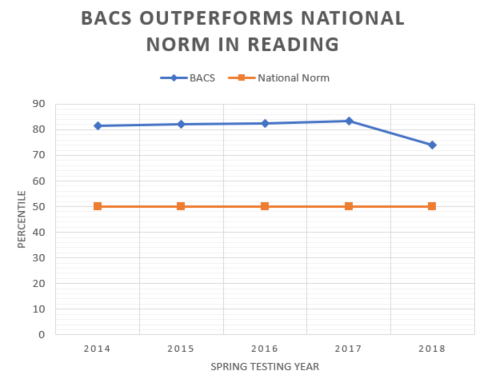
In the five years of MAP data, 100% of grade level averages exceeded the 50th national percentile in MAP Reading, at an average of 81% over the five years of MAP use. Spring 2018 reading scores revealed a slight decline in some grade levels, as teachers learn the full power of instruction with the EL Modules.
|
Looking Back...
Our students have historically outperformed the county and state averages on standardized tests. In order to minimize funding gaps, our school launched a growth model spanning several years. Our school grew from about 500 students to almost 800 in a short period of time. Maintaining our high level of achievement was a priority with our school, despite our rapid growth.
Looking Forward...
With our population growth came demographic changes mirroring our county. We have pushed our students to excel not only on the state standardized tests, but on a nationally norm-referenced test as well. Our students continue to outperform the county and the state, and we are tracking upward with the best in the nation. We are looking forward to continuing to cultivate a culture of engagement and achievement (Core Practice 27) and guiding our students to become leaders of their own learning. Partnering with EL Education has made our instruction more intentional, our curriculum more engaging, and our leadership more strategic so that we can meet our performance benchmarks each year.
